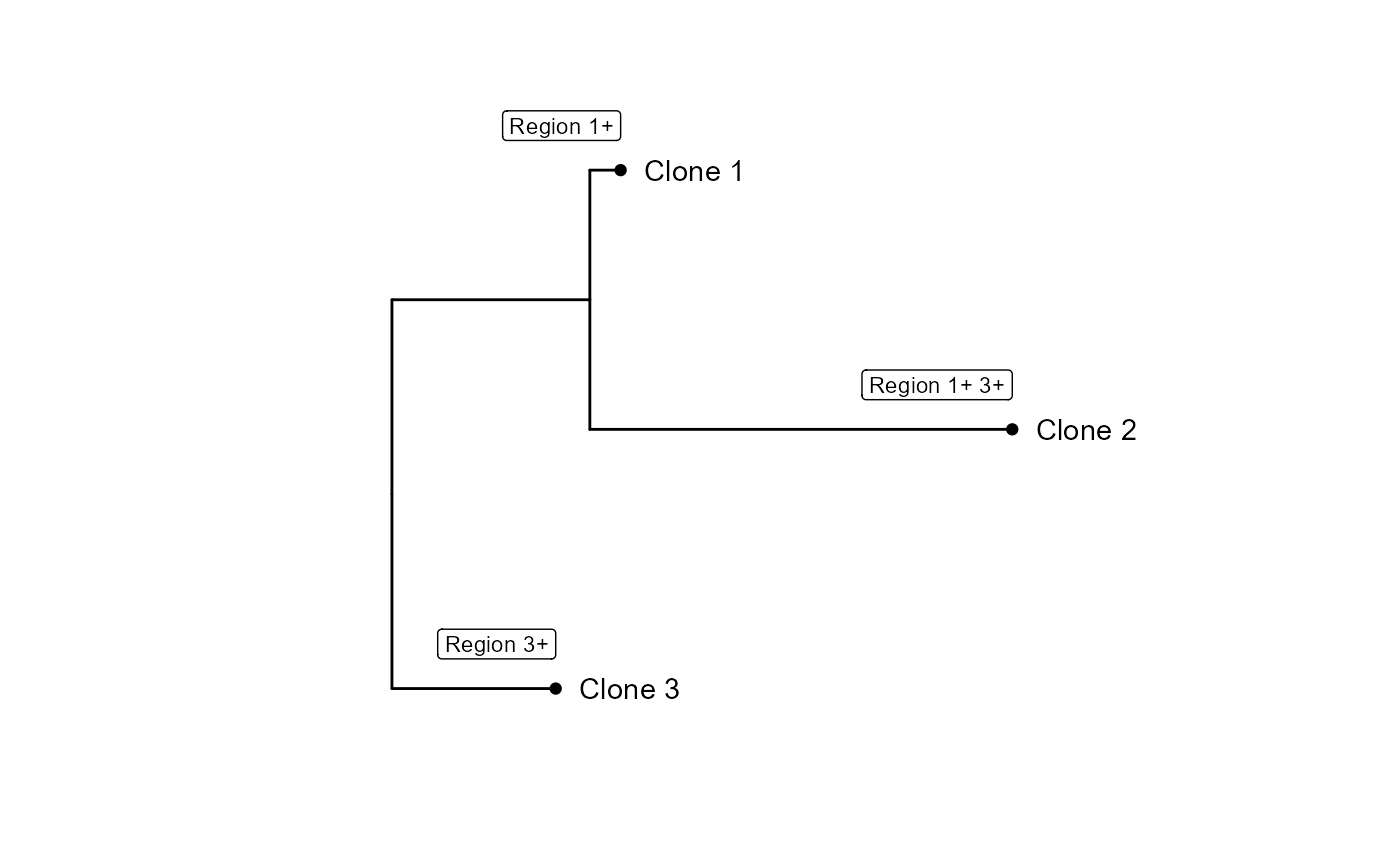
Plot an Annotated Phylogenetic Tree with CNV Events
plotCNVtree.RdThis function generates a plot of an annotated phylogenetic tree using ggtree.
It displays tip labels, tip points, and labels for CNV events associated with
each node.
Examples
cnv_matrix <- structure(c(0.2, 0.4, 0, 0, 0.1, 0, 0.1, 0.2, 0.2), dim = c(3L,
3L), dimnames = list(c("Clone 1", "Clone 2", "Clone 3"), c("Region 1",
                                                          "Region 2", "Region 3")))
tree <- CNVtree(cnv_matrix)
tree_data <- annotateCNVtree(tree, cnv_matrix)
#> Joining with `by = join_by(node, label)`
plotCNVtree(tree_data)
#> Warning: Removed 2 rows containing missing values or values outside the scale range
#> (`geom_label()`).